|
Lights-Out for Windows Server Solutions 2011/2012
|
   |
   |
Uptime chart page tab
|
Lights-Out for Windows Server Solutions 2011/2012
|
|
|
Recorded uptime of your devices are visualized in the uptime chart.
You can use the diagram to find out when a backup took place or which client computer was active and prevented the server from sleeping. The diagram uses 11 colors. When you have more than 11 items, the colors are repeated. The diagrams are created from left to right in the same order as the legend from top down.
Sources, which are only displayed and not used for monitoring are displayed with a dashed style. Want to know more? Look at the details.
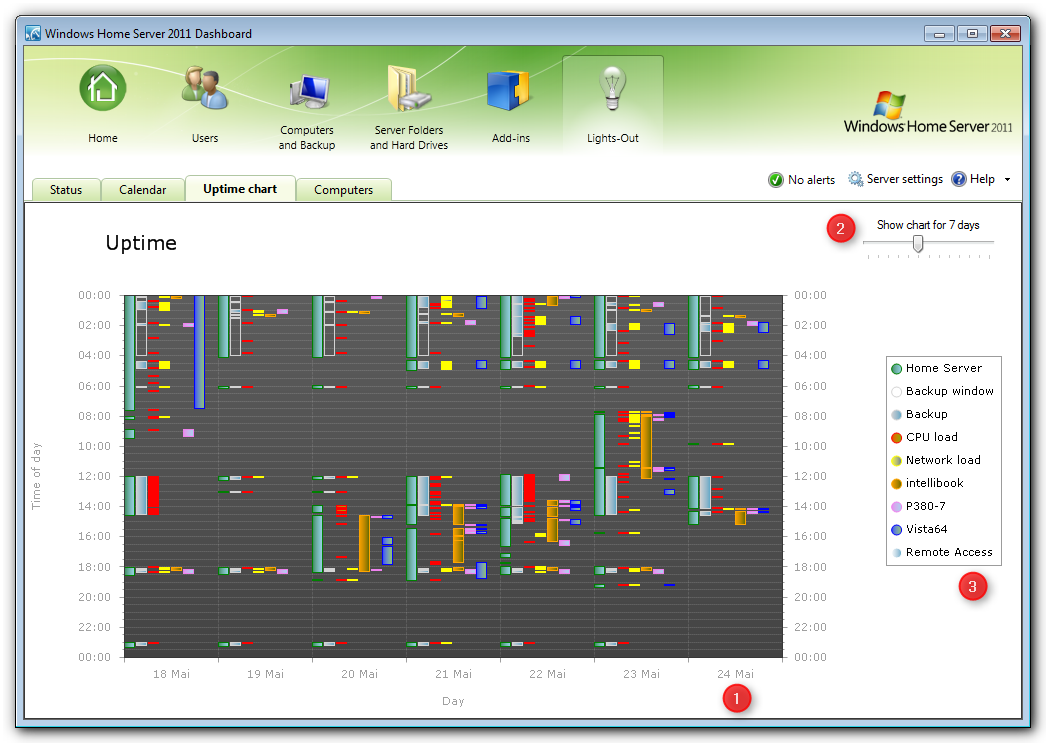
The current day is always placed on the right side (1).
Use the slider (2) to change the days displayed between 2 and 14.
Look at the legend (3) to identify the devices by name or move the mouse over a color bar.
Recording takes only place when your server is running. You do not see active clients while your server is in standby.
|
Name |
Description |
|
What’s the uptime chart good for? You can easily locate the source which keeps your server awake. You can also check your computers uptime and you can verify that a backup took place at an expected point in time and much more. | |
|
Samples for 2 and 14 days |
|
Copyright (c) Martin Rothschink, AxoNet Software GmbH 2008-2015
|
|
What do you think about this topic? Send feedback!
|